Kubernetes Observability
Implement comprehensive monitoring, logging, and tracing for Kubernetes workloads.
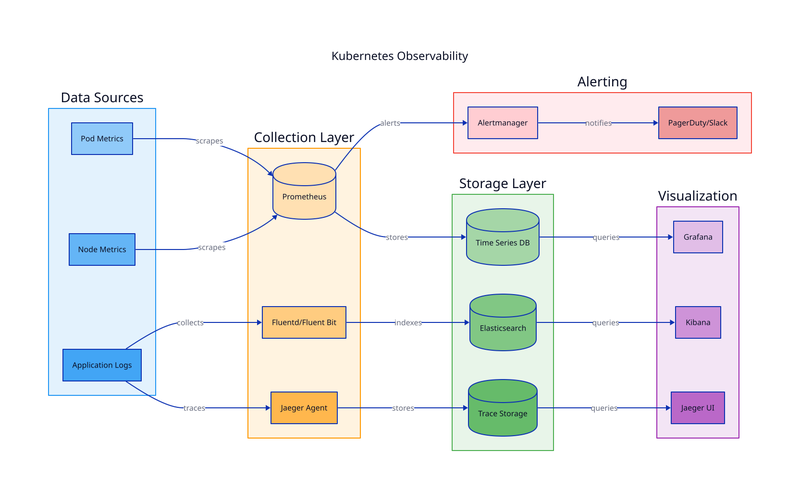
Kubernetes observability stack with Prometheus, Grafana, and distributed tracing
Observability in Kubernetes requires collecting and correlating metrics, logs, and traces from both the platform and applications.
Observability stack:
- Prometheus - Metrics collection and alerting
- Grafana - Visualization and dashboards
- Loki/EFK - Log aggregation and search
- Jaeger - Distributed tracing
Key Concepts
- Use Prometheus Operator for management
- Set up alerts for SLO violations
- Correlate logs with trace IDs
- Monitor control plane health
- Capacity planning from metrics
Need Help with AWS Architecture?
Book a free consultation to discuss your cloud infrastructure needs.
Schedule a Call